An injury does not announce itself. It builds quietly. Training load accumulates. Sleep debt compounds. A minor movement asymmetry becomes chronic tension. Then one day during a sprint or a jump or a simple change of direction, something gives way.
The traditional sports medicine model is reactive. You get hurt. You see a physio. You rehabilitate. You return. The wearable revolution is pushing sports toward something far more valuable: a proactive model where the data tells you something is wrong before your body does.
That shift is happening right now. And it is changing how athletes at every level train, compete, and stay healthy.
Why Injury Prevention Is Now a Data Problem
Most sports injuries are not random accidents. They are predictable outcomes of specific conditions. Too much training load applied too quickly. Not enough sleep for the recovery demands being placed on the body. Accumulated fatigue changing movement mechanics in ways invisible to the naked eye but measurable by sensors.
Research published in the British Journal of Sports Medicine has established that the acute to chronic workload ratio is one of the strongest predictors of soft tissue injury in team sport athletes. When the training load of the past week is significantly higher than the training load of the past four weeks, injury risk spikes. This relationship was known theoretically for decades. Wearables made it measurable in real time for every athlete on a squad.
The same research framework applies to individual athletes. A runner who has been averaging 40 kilometers per week for three months and suddenly jumps to 65 kilometers in a single week has created an acute spike in their workload ratio. The hamstrings, Achilles tendons, and plantar fascia are now under stress they have not been conditioned to handle. Knowing that number in advance gives the athlete and coach the chance to intervene before the tendon sends its own version of the warning.
That is what wearables make possible. Systematic, continuous data collection that turns injury prevention from intuition into information.
GPS and Accelerometer Technology: Tracking What the Eye Cannot See
The foundation of performance tracking in team sports is GPS and accelerometer technology. The combination tells coaches and performance staff not just how far athletes moved but how they moved, and at what intensity.
Modern GPS vests worn by professional athletes in soccer, rugby, Australian rules football, and basketball capture distance covered, top speed reached, high-speed running distance, sprint count, acceleration events, deceleration events, and changes of direction. These are not just performance metrics. They are injury risk indicators.
Decelerations are particularly important and consistently underappreciated. Stopping from speed places far greater eccentric load on the hamstrings and quadriceps than any acceleration. An athlete who performs 40 high-intensity decelerations in a training session has placed significant stress on their posterior chain regardless of how far they ran. Hamstring injury risk increases when deceleration counts spike without adequate conditioning base. GPS systems make these numbers visible. Without them, a coach watching practice might see 90 minutes of activity and have no idea the deceleration count was twice the normal value.
Accelerometer data embedded in wrist-worn devices adds another dimension. Impact load, jump counts, and landing intensity can all be tracked without GPS coverage. Volleyball players, basketball players, and gymnasts who spend significant time in the air now have tools to quantify the cumulative landing load their joints absorb across a training week. That number, tracked over time, reveals when an athlete is approaching the threshold where stress fractures and tendinopathies become more likely.
Consumer versions of this technology have arrived. The STATSports Apex Consumer GPS vest, available for under $200, provides team sport athletes with professional-grade movement tracking outside of professional contracts. The data feeds directly to a smartphone app with session summaries, weekly load comparisons, and intensity zone breakdowns.
Heart Rate Variability: The Nervous System’s Report Card
Of all the metrics modern wearables track, heart rate variability remains the single most informative signal for understanding an athlete’s readiness and resilience.
HRV measures the variation between consecutive heartbeats. A high HRV means the autonomic nervous system is in a flexible, parasympathetic-dominant state. The body is recovered, regulated, and ready to handle stress. A low HRV means the sympathetic system is dominant. The body is under load, whether from training, illness, emotional stress, or inadequate sleep.
For injury prevention, the HRV trend line across weeks is more important than any single reading. A sustained downward trend in HRV during a period of unchanged or increasing training load is a reliable early warning that the athlete’s adaptive capacity is being exceeded. This pattern often precedes illness or soft tissue injury by several days to a week.
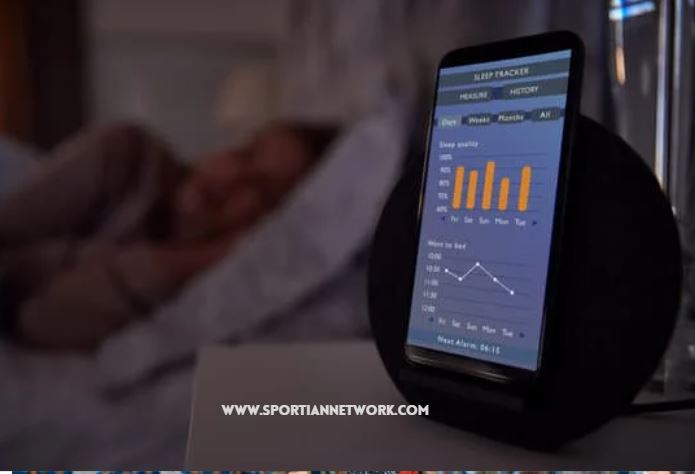
The sleep tracking wearables guide on Sportian Network covers HRV measurement in detail. The key practical point is that wearables measuring HRV overnight, during sleep, produce the most reliable readings because they eliminate the confounding variables of posture, caffeine, and movement that affect spot-check measurements.
Platforms like Whoop, Oura Ring, and Polar have built their entire readiness scoring systems on overnight HRV as the primary input. The readiness scores these devices generate are, at their core, injury and overtraining risk assessments expressed in athlete-friendly language. A Whoop recovery score of 30 percent is telling you the same thing a sports scientist would say after reviewing your overnight biometrics: today is not the day to set personal records.
Load Monitoring: The Numbers Behind Smart Programming
The most direct application of wearable data to injury prevention is systematic load monitoring. The concept is straightforward. Track the stress you place on the body. Compare it to what the body has been conditioned to handle. Manage the gap.
The acute to chronic workload ratio, mentioned earlier, uses training load data from wearables to generate a number. An acute to chronic ratio between 0.8 and 1.3 represents a safe zone where the athlete is training hard enough to improve but not so far above their conditioned baseline that injury risk significantly elevates. Above 1.5 is the danger zone consistently found in sports science research to correlate with injury spikes.
Periodization frameworks that have existed for decades as theoretical training models can now be monitored in real time with wearable data. A planned build phase that looks reasonable on paper might generate acute to chronic ratios above 1.5 for specific athletes whose baseline is lower than assumed. The wearable catches this. The paper plan does not.
Professional teams using platforms like Catapult, STATSports, and PlayerTek have moved to daily load monitoring as standard practice. Every training session generates a load score. The coaching staff can see at a glance whether the previous day’s recovery session actually produced lower load than intended, or whether what looked like a light day still generated substantial movement stress because the players were moving intensely within the lower-volume session.
For individual athletes, the same principles apply at a smaller scale. A runner using Garmin’s Training Load feature or a cyclist tracking Training Stress Score through TrainingPeaks has access to the same load management logic that professional sports teams use. The tool is democratic now. The willingness to use it systematically is the variable.
Biomechanical Wearables: When Sensors Go Inside the Movement
The next frontier in wearable injury prevention technology goes beyond tracking how much athletes move to analyzing how they move at a biomechanical level.
Smart insoles from companies like Moticon and Nurvv embed pressure sensors across the entire foot contact area. They measure force distribution, center of pressure, pronation angle, and left-right load asymmetry with every step. For runners, the data identifies whether one leg is consistently absorbing more impact than the other, a pattern strongly associated with overuse injuries on the overloaded side. For athletes returning from ankle or knee injuries, the insoles quantify whether movement asymmetry has normalized or whether compensatory patterns are persisting after the acute pain has resolved.
Inertial measurement units placed on body segments measure acceleration, rotation, and orientation in three dimensions. Companies like Xsens and Noraxon produce full-body sensor suits for clinical and research settings. Simplified versions are finding their way into sport-specific applications. Swimmers can wear IMU sensors that measure stroke symmetry and catch mechanics. Cyclists can track hip drop and pelvic stability through pedal strokes. Golfers can analyze swing rotation and timing.
Electromyography wearables measure muscle activation patterns during movement. Traditional EMG required adhesive electrodes and laboratory conditions. Wearable dry electrode systems now allow muscle activation to be measured during actual sport. For athletes recovering from hamstring strains or ACL injuries, EMG wearables can confirm whether the injured muscle is activating correctly during functional movements before return to full training, removing some of the guesswork from rehabilitation clearance.
Performance Tracking: What Wearables Actually Measure Well
Beyond injury prevention, wearables have transformed performance tracking across virtually every sport. The data athletes now have access to during and after training sessions would have required a full laboratory setup a generation ago.
Running economy and power. Wrist-based running dynamics metrics from Garmin and Polar measure cadence, ground contact time, vertical oscillation, and stride length. Together these variables describe running economy, how efficiently the athlete converts energy into forward motion. Stryd’s foot pod takes this further by measuring actual running power in watts, the same concept as cycling power applied to running. Athletes can now train to running power targets rather than pace or heart rate, producing more consistent training stimuli across varying terrain and conditions.
Cycling power. Power meters have been available in cycling for decades but have become dramatically more accessible and accurate in the past five years. Stages, Garmin Vector, and Favero Assioma pedal-based power meters provide left-right power distribution data that identifies pedal stroke asymmetries. A consistent 55 to 45 percent power split between legs suggests either a limb length discrepancy, a movement compensation pattern, or residual weakness from a prior injury. Tracking this metric over a training block shows whether targeted strength work is correcting the asymmetry or whether it is persisting.
Sleep architecture and recovery quality. The ability to track deep sleep percentage, REM sleep duration, and overnight HRV gives athletes a genuine window into recovery quality that previously required polysomnography in a sleep lab. The connection between sleep quality and next-day performance is well established. Athletes who can see that their deep sleep percentage has been consistently below 15 percent for a week have an explanation for why training feels harder than usual, and a concrete target to address.
Swim performance metrics. The FORM Smart Swim Goggles display real-time pace, stroke rate, SWOLF score, and heart rate directly on the lens during pool sessions. Garmin and Apple Watch both provide stroke detection and lap counting for pool swimming. Athletes can track stroke rate trends across sets, see exactly when pace drops and by how much, and quantify improvements in SWOLF score, a combined measure of stroke count and time per lap, that reflects improving efficiency.
Wearables in Youth Sport: Opportunity and Responsibility
The application of wearable technology to youth athletes presents both significant opportunity and important responsibility.
Youth overtraining is a genuine and underappreciated problem in sports. Young athletes are particularly vulnerable because their tendons and bones are still developing, their subjective perception of fatigue is less reliable than adults, and the culture around youth sport often rewards pushing through discomfort rather than managing load intelligently.
Wearable load monitoring applied to youth sport gives coaches objective data to make programming decisions that young athletes cannot make for themselves. A 14-year-old distance runner whose GPS data shows they have increased their weekly mileage by 30 percent over three weeks is at risk regardless of how good they feel. The data catches what the athlete and their enthusiasm cannot.
The responsibility dimension involves data interpretation and athlete wellbeing. Young athletes who become overly focused on metrics, particularly readiness scores and recovery numbers, can develop anxiety around training decisions or unhealthy relationships with data. The tools should inform coaches and parents, not overwhelm young athletes with numbers they lack the context to interpret. Adults in their sporting environment need to handle the data and translate it into simple, actionable decisions.
The Gap Between Data and Action
The biggest limitation of wearable technology for injury prevention is not the technology itself. It is the human behavior around it.
A wearable that correctly identifies elevated injury risk through HRV suppression, load spikes, and poor sleep data is useless if the athlete ignores the warning and trains hard anyway. The tool provides information. The athlete or coach makes the decision. And the decision is still influenced by ego, competitive pressure, fear of missing training, and the deeply ingrained athlete identity that equates rest with weakness.
This is where the mental toughness framework intersects directly with performance technology. The genuinely mentally tough athlete is the one who can look at a red recovery score and make the intelligent decision to modify the session. Not because they are afraid. Because they understand that protecting their availability to train consistently over months is worth more than any individual session.
The athletes who use wearable data most effectively are those who have already internalized that recovery is not weakness but performance infrastructure. The wearable confirms what they already believe. For athletes who have not internalized that, the wearable becomes just another dashboard they check and then ignore when it says something inconvenient.
Building the habit of acting on the data takes time and deliberate practice. Start with one metric. Track it for four weeks. Identify one training decision you changed based on it. Build from there. The athletes who transform wearable data into genuine injury prevention are not the ones with the most sophisticated device. They are the ones who check consistently, interpret honestly, and act accordingly.
The Future Direction: What Is Coming Next
The wearable injury prevention space is moving fast. Several technologies currently in research or early professional use will reach serious amateur athletes within the next two to three years.
Continuous lactate monitoring is one of the most anticipated. Blood lactate is the gold standard for identifying training zones and metabolic thresholds. Currently it requires finger prick testing during session pauses. Wearable patches that measure lactate through sweat continuously during exercise are in clinical testing. When these arrive at consumer prices they will fundamentally change how endurance athletes identify and train their aerobic and anaerobic thresholds.
Continuous glucose monitoring is already consumer-available and being used by performance athletes to understand how blood glucose fluctuates during different types of training and across the day. The connection between glycogen availability and both performance and injury risk is well established. Real-time glucose data during training takes the nutrition timing principles covered in the nutrition timing guide on Sportian Network from generalized guidelines to individualized, session-specific decisions.
Hydration sensors measuring sweat sodium concentration and fluid loss rates are in development. Current hydration management relies on pre and post-training weight measurement and urine color assessment. Wearable hydration monitoring that tracks fluid status continuously during exercise would remove one of the last major performance variables still managed by guesswork for most athletes.
Final Word
Wearable technology has not eliminated sports injuries. That was never a realistic expectation. What it has done is shift the conversation from reactive to proactive, from guesswork to data, and from generic programming to individualized load management.
The athletes and coaches who use these tools systematically, who check the data before making session decisions, who act on warning signs rather than pushing through them, are genuinely reducing their injury rates and improving the quality of their training over time. The evidence from professional sports is consistent on this.
The tools are accessible now. The data is there. What remains is the discipline to use it intelligently and the wisdom to understand what no device can measure: the judgment, context, and human understanding that turns raw numbers into smart decisions.