Most coaches still trust their gut more than their data. Most athletes still train by feel. And most of the time, both are wrong in ways they will never notice until something breaks.
That is the problem sports analytics solves. Not by replacing coaching instinct but by giving it something real to stand on. A gut feeling backed by six weeks of GPS load data is not a gut feeling anymore. It is a decision.
This guide covers the tools that matter, how they actually work, and what coaches and athletes at every level should understand before using any of them.
What Sports Analytics Actually Does
Sports analytics is not about collecting numbers. Anyone can collect numbers. The job is using data to answer questions that matter during training and competition.
Questions like: Is this athlete recovering fast enough to train hard again tomorrow? Is the team’s pressing system working or just exhausting the players? Is this striker getting into good positions or just getting lucky on the goals they score?
Without analytics tools, those questions get answered by whoever speaks loudest in the room. With the right tools, they get answered by evidence.
That shift matters whether you coach a professional soccer team or a small BJJ academy. The principles are the same. Good data helps you see what training by feel tends to hide.
Understanding how periodization fits into your training structure is the foundation analytics builds on. Without a structured program, data has nothing meaningful to measure.
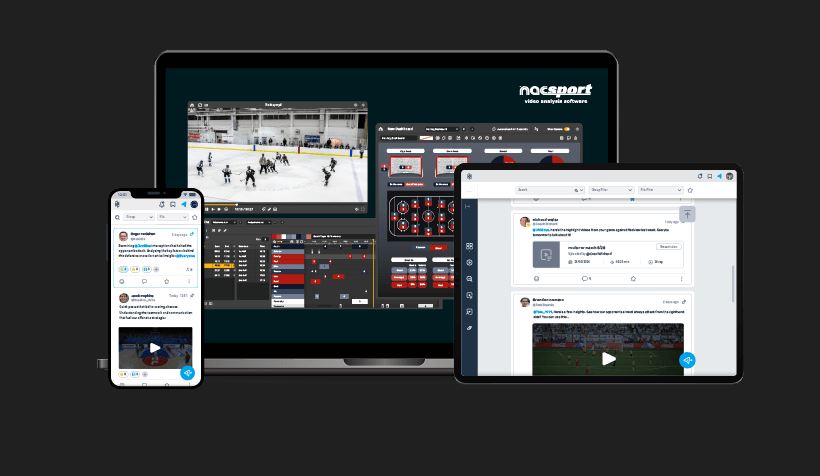
Video Analysis: What Coaches Can Now See
Before GPS, before wearables, before any tracking technology, coaches had one source of truth: video. That has not changed. Video remains the foundation of every serious performance analysis workflow because it shows context that no number can capture.
Hudl became the standard platform for video analysis because it solved the distribution problem. Coaches can film, tag, annotate, and share footage with players in minutes. A player watching a slow-motion clip of their defensive positioning understands the coaching point instantly in a way no verbal explanation comes close to matching.
The platform works across dozens of sports. High school teams use it the same way professional clubs do. A wrestler reviewing shot attempts, a volleyball setter studying tempo patterns, a cricket bowler analyzing their action frame by frame. Video analysis is not reserved for elite sport. It works for any coach serious enough to do the work.
What makes video analysis powerful is the tagging system. Coaches do not just watch footage. They code it. Every press from the opponent gets tagged. Every transition. Every set piece. Over time the tags build a database that reveals patterns invisible in real time. This is how analysts at top clubs walk into team meetings knowing exactly how many times the opposition loses possession during an early press. They counted it. The software helped them count fast.
We also covered Nacsport in a dedicated review for coaches looking at video coding tools with a different budget entry point.
Physical Load Tracking: The Tool That Changes Injury Management
The biggest shift in athlete management over the last fifteen years is not tactics or nutrition. It is workload monitoring.
Coaches used to build training programs based on time. Monday, Wednesday, Friday. Three sessions a week. Hard session, recovery session, game day. The problem is that two athletes doing identical sessions accumulate completely different physical stress. One is recovering well. The other is quietly building toward a soft tissue injury that will arrive six weeks from now.
Catapult is the dominant platform in this space. It uses GPS vests worn during training and matches to track distance covered, sprint count, acceleration, deceleration, and impact load. The data feeds into software that calculates each athlete’s accumulated stress over time.
The key concept is the acute to chronic workload ratio. This compares an athlete’s recent workload over the past week against their average workload over the previous month. Push that ratio too high and injury risk spikes. Keep it in the target range and athletes stay healthy while still getting fitter. Research published on PubMed has consistently supported workload monitoring as one of the most evidence-based injury prevention approaches in high-performance sport.
This sounds simple. In practice it is difficult without technology because the calculation requires clean, consistent data from every session across weeks and months. Catapult automates that. Coaches see each player’s daily status on a dashboard. The decision to push or protect becomes data-driven rather than a guess.
For contact sports like rugby, American football, and combat sports, the impact data adds another layer. Athletes absorb hundreds of collisions per session. The cumulative toll is not visible to the naked eye but it shows up clearly in the numbers. Smart conditioning staff use it to protect physically vulnerable players before problems develop.
This connects directly to the broader topic of how wearables are changing injury prevention across all sport levels. And for coaches managing younger athletes, youth overtraining is a real and underreported problem that load monitoring helps prevent.
Match Data: Reading the Game With Numbers
If video analysis shows what happened and load tracking shows what the body did, match data platforms show whether the decisions made during a game were actually good ones.
Opta, now part of Stats Perform, has been building sports databases since 1996. Their data covers more than 30 sports globally. In soccer alone, every touch, pass, shot, press, duel, and positional moment gets logged. Coaches use this data to evaluate tactical systems rather than chase individual moments.
Expected Goals (xG) is the most widely known metric to emerge from this world. Wikipedia’s xG entry explains the concept clearly: it assigns a probability to every shot based on location, shot type, and defensive pressure. A team that scores two goals from 0.4 xG got lucky that day. A team that scores two goals from 2.8 xG is creating genuine quality. Over a season those numbers reveal the truth about a team that raw results can mask.
For coaches, match data matters most in opponent preparation. Patterns in how a team defends under pressure, where their fullbacks push forward, which players exploit transition space. These trends show up in data long before a scout watching two or three games would pick them up.
StatsBomb, now integrated into Hudl, adds 360-degree positional data on top of standard event tracking. Beyond recording where the ball went, it captures where every player on the pitch was at each moment. A pass that looks routine in basic data looks completely different when you see that six defenders were already covering the target zone. The positional context turns match analysis into something much closer to the real game.
Wyscout: For Scouts, Academies, and Player Development
Scouting used to mean watching games in person. Long travel, expensive tickets, and the limitation of only seeing ninety minutes of one match.
Wyscout changed that. The platform holds video and data from over 600 leagues worldwide. A scout looking for a left-sided midfielder who presses high, completes passes under pressure, and covers significant ground can filter across thousands of players they have never watched. The search that once took months of travel takes hours on a screen.
For development academies, the value is different. Young players can watch how professionals in their position handle the same situations they face in training. A goalkeeper studying distribution from the top leagues has access to a reference library that simply did not exist before.
The data depth in Wyscout runs to approximately 2,000 tagged events per match. That granularity makes tactical patterns genuinely visible, not just the headline statistics.
Tools for Individual Athletes Without Team Resources
Most analytics coverage focuses on professional clubs. But the tools have moved down to individual athletes and small programs in ways that most people have not caught up with yet.
Wearable heart rate monitors combined with platforms like Whoop and Polar Flow give individual athletes the same readiness data professional teams use. Resting heart rate trends, heart rate variability, sleep quality, and training load all feed into daily readiness scores that take the guesswork out of training intensity decisions.
This matters most for athletes training without a coach watching every session. Distance runners, cyclists, combat sport practitioners, swimmers. The data creates accountability around recovery in a way training diaries and subjective feelings cannot replicate. Understanding how to use sleep tracking wearables for recovery is a practical starting point for athletes new to this space. For a broader look at options, our guide to fitness trackers for serious athletic performance covers what to prioritize at different budget levels.
Dartfish serves coaches who need motion analysis without a professional system budget. The software breaks movement down frame by frame. A swimmer’s stroke entry angle. A javelin thrower’s release position. A tennis player’s contact point on a backhand. Comparison tools let coaches overlay a model movement against an athlete’s current technique and show the gap clearly.
For strength athletes, force plate technology has become accessible enough that serious gyms now own it. Force plates measure ground reaction forces during jumps, squats, and sprint starts. The data reveals asymmetries between left and right leg, rate of force development, and reactive strength. These numbers help coaches catch imbalances before they become injuries and confirm whether strength training is actually transferring into athletic output.
The Role of AI in Modern Sports Analytics
The newest layer in sports analytics is artificial intelligence applied directly to coaching decisions. Platforms now exist that analyze training data, flag risk patterns, and recommend session adjustments without waiting for a human analyst to run the numbers.
AI-powered coaching apps are making this accessible below professional club level. The core function is pattern recognition at a scale no human analyst manages alone. Detecting that a specific athlete’s sprint velocity drops in the final twenty minutes of every session. Flagging that a team’s defensive shape breaks down specifically when pressing from goal kicks. Finding these patterns in real time changes what coaches can act on.
ESPN’s sports analytics coverage has tracked how this shift moved from baseball’s Moneyball era into every major sport. The underlying principle is always the same: better information leads to better decisions.
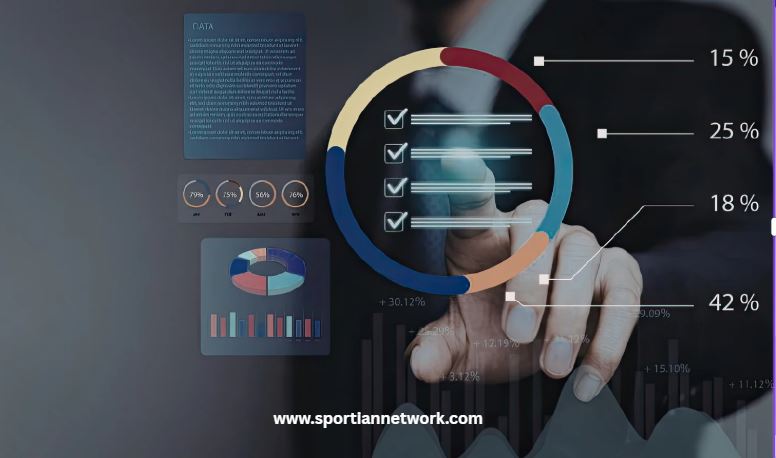
Data Visualization: The Part Most Teams Skip
Having data is not the same as understanding data. Every platform includes dashboards and charts. The problem is that most coaches and athletes were never trained to interpret them.
The most common mistake is chasing metrics that look interesting rather than metrics that answer specific coaching questions. A coach staring at a heat map is looking at data. A coach asking whether the team gives up too much space behind the defensive line during high pressing, and then finding that answer in the heat map, is using analytics properly.
Tools like Tableau are used by professional sports organizations to build custom visualizations that go beyond standard platform dashboards. Analysts pull data from multiple sources and build displays showing exactly what the coaching staff needs before each game. Most top clubs at this level have dedicated analysts whose entire job is building and maintaining those pipelines.
For coaches without that support, the practical approach is simpler. Pick three metrics that directly connect to your tactical or physical philosophy. Track them consistently across a full season. The value of analytics is not in the complexity of what you measure. It is in the consistency of measuring it.
Tapering and Peak Performance: Where Analytics Closes the Loop
One area where analytics delivers unusually clear value is competition preparation. The question of when to reduce training load before a major event is one of the most important decisions a coach makes, and it is one where gut feel has historically produced the worst outcomes.
Load tracking data makes tapering a science rather than a guess. Coaches can see when an athlete’s accumulated fatigue is dropping and freshness is rising. They can time that window to align with competition day rather than hoping the numbers work out. Our detailed breakdown of the science of tapering covers exactly how to structure this process.
The intersection of load data and recovery strategy is also where understanding recovery as a training variable becomes essential. Athletes who treat recovery as passive downtime leave measurable performance on the table.
What Analytics Cannot Do
This matters more than any tool on the list.
No analytics platform makes coaching decisions. The data shows what happened and suggests probabilities. The coach still decides what to do with it.
There is a real risk in over-relying on metrics for decisions that require human judgment. A player’s heart rate variability score might say they are recovered and ready for full training. The athlete might know their head is not in it today for reasons no wearable can detect. A coach who dismisses that in favor of the number has misunderstood the tool.
Mental performance sits in a space that data cannot fully reach. The mental toughness work that separates elite athletes happens in the mind, not on a dashboard. Analytics narrows the gap between what coaches think they see and what is actually happening. It does not replace the knowledge required to do something useful with what you find.
The best coaches treat data as one input among many. Video shows context. Load data shows physical stress. Match data shows patterns. But relationship, communication, and understanding the athlete as a full person sit above all of it.
Where to Start
For any coach or athlete bringing analytics into their program for the first time, the starting point is straightforward.
Start with video. Hudl’s entry-level offering is affordable and immediately useful. Watch sessions back. Code key moments. Share clips with athletes. Build the habit of reviewing before doing.
Add load monitoring once video is consistent. A basic wearable covering heart rate and sleep handles most of what individual athletes need. GPS vests make financial sense when managing five or more athletes in a contact sport.
Match data platforms are built for clubs and organizations. If you work in a team environment, advocate for access. If not, StatsBomb makes free open data available for soccer research that gives a genuine introduction to how advanced event data works.
The tools exist. The question is whether the commitment to using them consistently does too. That commitment is what separates teams that collect data from teams that actually improve because of it.
Sports analytics is not a shortcut. It is a discipline. Coaches and athletes who treat it that way get the results everyone else is trying to explain.