Analyze Sports has built a reputation in the sports analytics space by doing something most platforms avoid. It tries to make data-driven performance analysis accessible to coaches who are not data scientists. The idea is right. The execution is genuinely useful in some areas and frustrating in others.
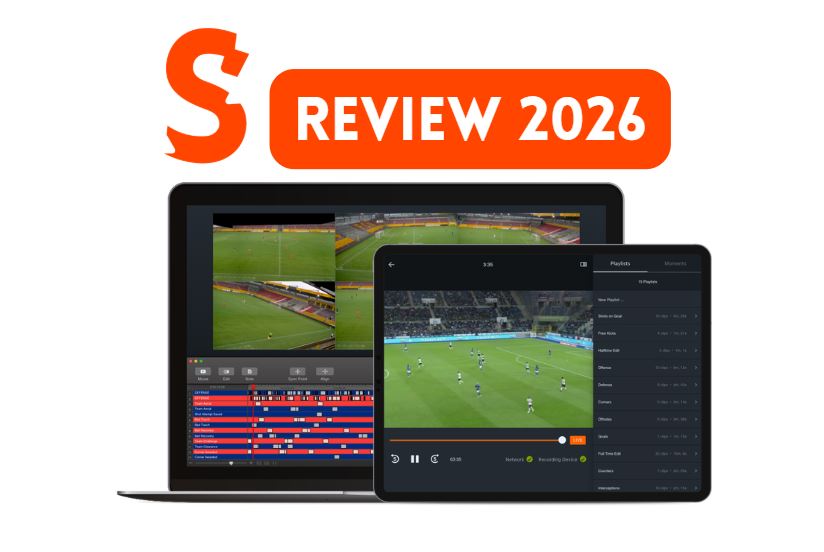
This review gives you the honest picture. What Analyze Sports does well, where it falls short, and the Sportian Network verdict on who should actually use it.
What Is Analyze Sports?
Analyze Sports is a cloud-based sports performance analysis platform. It allows coaches, analysts, and sports organizations to collect, visualize, and act on athlete performance data without requiring advanced technical expertise or a dedicated analytics department.
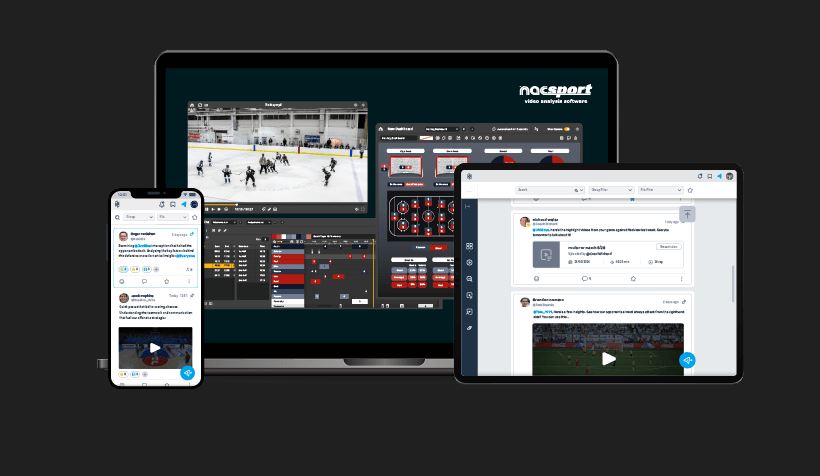
The platform sits in a specific niche. It is not a video coding tool like Hudl Sportscode or Nacsport. It does not compete directly with Catapult or STATSports on GPS tracking hardware. Instead it focuses on the data layer. Collecting metrics from multiple sources, visualizing them in dashboards, and surfacing insights coaches can act on.
That positioning makes it complementary to other tools rather than a standalone solution. Understanding that upfront saves a lot of frustration.
Interface and Ease of Use
This is where Analyze Sports makes its clearest pitch. The interface is designed for coaches first, analysts second. Dashboards are visual. Data is presented in charts, heat maps, and summaries rather than raw spreadsheets. Navigation is straightforward.
For a club-level coach with no formal analytics background, that matters. Most performance data platforms require significant onboarding before they become useful. Analyze Sports compresses that learning curve meaningfully. A coach with basic digital literacy can set up a dashboard, enter session data, and generate a readable performance report within a single day of use.
The trade-off is depth. Users who want granular control over data queries, custom formulas, or complex multi-variable filters quickly hit the ceiling of what the interface allows. The simplicity that welcomes non-technical users also restricts experienced analysts who need more.
For coaching contexts where the person entering and reviewing data is the same person running sessions, this balance works. For organizations with dedicated analytics staff, it feels limited.
Interface score: 3.5 out of 5.
Data Collection and Integration
Analyze Sports accepts data from multiple input methods. Manual entry through the platform’s forms. CSV import from external sources. Integration with select wearable devices and GPS systems.
The manual entry tools are clean and organized. Building a session log, entering physical test results, or recording subjective wellness scores is fast. The forms are logically structured. This part of the platform works well and consistently.
The integration story is more complicated. Analyze Sports connects with some popular wearable platforms but the list of native integrations is narrower than competitors at similar price points. Teams already running Whoop, Garmin, or Polar ecosystems may find the data pipeline requires more manual work than expected. The platform does not yet offer the seamless automatic sync that the best wearable-connected analytics tools provide.
CSV import fills the gap for most users. It is functional but adds a workflow step that automated integration would eliminate. For a high-volume sports organization logging data from dozens of athletes daily, that friction adds up across a season.
The connection between clean data collection and effective training load management is direct. A platform that makes data entry fast and accurate supports better load decisions downstream. Analyze Sports delivers on the entry side. The integration gaps limit how automated that process can become.
Data collection score: 3 out of 5.
Dashboards and Visualization
The dashboard system is the platform’s strongest feature. Coaches can build custom views combining multiple data streams into a single screen. Individual athlete profiles sit alongside team aggregate views. Trend lines across weeks and months are clearly visualized. Color coding for alert thresholds, flagging athletes who fall below or above defined parameters, is intuitive to configure.
For a head coach doing a quick pre-training review, the dashboard answers the right questions fast. Who is flagged for low readiness today? Which athletes have seen consistent performance drops over the past two weeks? Where is the squad trending on physical test benchmarks?
These are exactly the questions that AI-powered coaching systems are also trying to answer, and Analyze Sports does it in a way that keeps humans in control of the interpretation rather than handing decisions to an algorithm. That is actually a genuine advantage for coaching cultures that want data informing decisions rather than making them.
The limitation is that dashboards become complex quickly when you are tracking large squads across many metrics. Filtering, grouping, and segmenting data at scale requires patience. The platform handles small to medium squad sizes cleanly. Large professional rosters push the visualization tools toward their limits.
Dashboard score: 3.5 out of 5.
Performance Testing and Benchmarking
Analyze Sports includes built-in templates for common physical performance tests. Sprint times, jump height, strength benchmarks, aerobic fitness scores, and flexibility assessments can all be logged and tracked over time.
The benchmarking system lets coaches compare individual athlete scores against squad averages, historical personal bests, or custom target ranges. This is useful for tracking development across a season and identifying athletes who are trending downward before performance drops show up in competition.
The test result visualization is clean. Progress charts per athlete are readable. Comparison views across the squad are functional. For youth academies, college programs, and semi-professional clubs running regular physical testing batteries, this feature set is genuinely practical.
The gap is sport-specificity. The testing templates are generic. A basketball coach tracking agility and vertical jump has the same template structure as a distance running coach tracking VO2 max estimates. There is no sport-specific testing framework built in. Building custom test batteries from scratch is possible but requires more setup than a sport-specific platform would need.
Connecting physical test data to training programming is also manual. Analyze Sports shows you the data. It does not generate training recommendations from it the way an integrated periodization tool would. The coach makes the call. The platform provides the information.
Testing and benchmarking score: 3 out of 5.
Reporting and Communication
One practical strength of Analyze Sports is its reporting output. The platform generates clean, readable reports that coaches can share with athletes, parents, or club management without requiring the recipient to log into the system themselves.
PDF exports are well-formatted. Individual athlete reports covering physical test results, wellness trends, and session load summaries look professional. For youth academy directors who need to communicate development progress to parents, or for coaches presenting performance data to club boards, this feature has real value.
Athlete-facing communication is simpler than some competing platforms. Athletes can view their own dashboards through the platform’s athlete portal. The portal is clean and readable. It does not overwhelm athletes with data. It gives them the key numbers and trends they need to understand their own development.
The mental performance side of athlete development is not captured in the platform. Analyze Sports tracks physical and physiological data well. Psychological wellness check-ins can be added through custom forms but there is no structured mental performance tracking framework built in.
Reporting score: 3.5 out of 5.
Pricing and Value
Analyze Sports uses a tiered pricing model based on squad size and feature access. Entry-level plans are accessible for smaller clubs and individual coaches. Higher tiers unlock larger squad capacity, advanced analytics features, and priority support.
Exact pricing requires a quote from the Analyze Sports team based on organization size. Based on available market information, the entry-level tier sits at a price point competitive with similar mid-market analytics platforms. It is not free. It is not enterprise-level expensive. It occupies the middle ground.
For clubs at the semi-professional and serious amateur level who currently use spreadsheets or disconnected tools to track athlete data, Analyze Sports represents a genuine upgrade in data organization and accessibility. The value is clearest in that specific context.
For professional organizations with larger budgets and more complex analytical needs, the platform’s ceiling becomes a limiting factor before the price becomes a concern. They will outgrow it.
Value score: 3 out of 5.
The Sportian Network Verdict
Here is our honest take on Analyze Sports.
The platform does what it promises for a specific audience. If you are a coach or sports director at a youth academy, semi-professional club, or university program who wants to organize athlete data, track physical development, and communicate progress clearly, Analyze Sports solves your problem at a fair price.
If you are a professional analyst who needs deep video integration, complex multi-variable queries, automated wearable sync, or AI-driven insights, you will hit the ceiling fast.
What we would suggest to the Analyze Sports team: The biggest opportunity is deeper wearable integration. The platform’s value increases significantly when data flows automatically from devices athletes are already wearing rather than requiring manual entry or CSV imports. In 2026, manual data pipelines are a friction point that costs user retention. Closing that gap would move this platform from a 3 to a 4.
The second suggestion is sport-specific testing frameworks. Giving coaches a basketball testing protocol or a soccer-specific battery out of the box rather than building from generic templates would reduce setup time and increase the platform’s perceived expertise in specific sports. Sportian Network covers sport-specific performance from strength training to speed development to injury prevention across dozens of sports. A platform that mirrors that specificity earns more trust from serious coaches.
The third suggestion is a readiness score system. The platform collects wellness data but does not aggregate it into a daily readiness output coaches can act on immediately. Adding a simple readiness score calculated from overnight wellness inputs would make the morning pre-training review significantly more actionable.
Fix those three things and the rating goes up. As it stands, 3 out of 5 is the honest number for 2026.
Who Should Use Analyze Sports
Use it if you are a youth or academy coach who needs organized athlete tracking and clear parent-facing reporting. A university or college strength and conditioning coach managing 30 to 100 athletes across multiple sports. A semi-professional club looking to introduce data-informed decision-making without a dedicated analytics hire. An individual performance coach working with a small client roster who wants to professionalize data tracking.
Consider alternatives if you need deep video analysis integration. That is Hudl Sportscode or Nacsport territory. If you need professional GPS and movement tracking, look at Catapult or STATSports. If your primary need is AI-driven training recommendations, the AI coaching app ecosystem is further ahead on that specific capability.
Analyze Sports is a solid middle-tier platform. It knows its audience. It serves that audience reasonably well. The gaps are real but they are not dealbreakers for the right program.
| Feature | Score |
|---|---|
| Interface and Usability | 3.5 / 5 |
| Data Collection and Integration | 3 / 5 |
| Dashboards and Visualization | 3.5 / 5 |
| Performance Testing | 3 / 5 |
| Reporting and Communication | 3.5 / 5 |
| Value for Money | 3 / 5 |
| Overall | 3 / 5 |